Sunday, May 17, 2015

Field Activity 12: UAV Flights


Introduction

In the final lab of the semester we once again traveled to the Priory where we had conducted the last 2 labs. We had the opportunity this week to be presented with a basic tutorial of UAV (unmanned aerial vehicles) work in the field to collect data. Dr. Joe Hupy as well as one of our fellow students, Mike Bomber walked us through the entire process of preparing the UAV, setting the flight route, actually flying the craft and then viewing the data and collecting GCPs (ground control points). 

Methods

The Priory was a good area to fly the UAVs because it there are portions of open land that do not intersect with regions where there is high activity. The first step when using the UAVs in the field is to complete the pre-flight checklist (Fig. 1). It is imperative to follow these steps to the letter in order to ensure that errors can be minimized since a single error can cause your aircraft to be permanently damaged.


(Fig. 1) Dr. Joe Hupy, Mike and Zach prepare for the UAV flight by going through the pre-flight checklist.
Pre-Flight Checklist

1. Measure weather variables: temperature, wind speed, wind direction etc.
 -Temperature was 52 degrees F wind speed in this case was between 2 and 8 mph, wind direction was southeast.

2. Check electrical connections: 
-Motor, antenna and frame connected, propellers, battery and antenna secure
-While completing this portion of the checklist we ran into a problem. When the battery pack was put into the Iris UAV controller, they began to smoke so a few students assisted Mike in going back to campus to get new batteries for the controller. 

3. Power up the equipment

4. Connect devices to internet modem
 -It is important to connect the UAV and the computer program used to determine the route of the flight and  other specs to the internet so that the program can show the UAV location in relation to satellite images to make it easier to plan a flight mission

5. Connect base station to UAV
 -The base station is based on GPS

6. Make sure that the battery is at greater than 80% power
-It is extremely important to make sure that the battery on the UAV is greater than 80% because they use a great deal of power to fly. You want the battery to be so full because you never know if there are going to be issues and more battery life is needed while you are flying the UAV.

7. Transmitter should be on 

8. Make sure that the area is secure
 -It's important to make sure that the area in which you are flying the UAV is secure. We found that when we were flying the Matrix UAV the wind made it necessary to land before the flight mission was complete. Because the wind was so strong the UAV could not land in the original starting point and our class had to move around a lot to make sure we did not get in the way of its landing procedure.

9. Turn sensors on

10. Turn on the camera 
 -A wide variety of cameras can be mounted to the UAVs themselves to collect imagery while they are flying their missions. The Isis UAV used a GoPro camera for example.

11. Complete the take off sequence

12. Fly the planned mission

13. Land the UAV

14. Disconnect the UAV and program

15. Complete a post flight log report


(Fig.2) Dr. Hupy and Mike disconnect the UAV after it has completed the flight mission.
We flew two different UAV units: the Iris (Fig. 3) and the Matrix (Fig. 4). The Iris was a much smaller and cheaper unit to fly and we found it did not have many issues while in flight. However, the Matrix was launched second, after the winds had begun to get stronger. We could notice right away the effect that the wind was having a pretty severe impact on the UAV. Mike, who was monitoring the flight mission noticed that there was a decreasing number of satellites available to the UAV as it was flying and made the decision to tell Dr. Hupy to land the craft. While the UAVs have the capabilities to autocorrect to compensate for wind and other factors sometimes the conditions just get too bad and it becomes unstable to fly the UAVs. 


(Fig. 3) This is the Iris UAV craft.
(Fig. 4) This is the Matrix UAV while in flight.
Once we had collected the two different sets of imagery using both of the UAV units a few students used the TopCon HiPer to collect GCPs (ground control points) around the study area. This data can then be used in the post processing phase in order to sync the imagery collected using the UAVs with the GPS data to make sure the spatial extent of the images is accurate. 

While students collect the GCPs throughout the study area, Dr. Hupy ran a process whih mosaic's all the images collected by the camera attached to the UAV together to provide the viewer with a consistent, single image of the study area (Fig. 5). 
(Fig. 5) Once the program creates the mosaic of the many images taken by the UAV camera we can see a more complete rendering of our study area.
Conclusion

I really enjoyed this lab because it gave us an opportunity to work with UAVs (even if just indirectly) which is not something that a lot of universities offer. It was interesting as well to gain a better perspective on the impact that these units could have on society as a whole. While it can collect invaluable geographic information, it is a bit creepy the amount of detail that these UAVs can capture in the imagery (Fig. 6).


(Fig. 6) This is one portion of the UAV imagery collected while we were in the field and as can be seen in the upper left-hand corner our class is watching the unit fly.
From a more geographic perspective however this technology amazed me. The fact that it can accurately correct itself to take into consideration wind speed and direction was astonishing. We even saw this taking place in the air while the Iris UAV was flying its mission. These sensors are capable of such great things and I am very hopeful that I will have an opportunity to work with them in the future. 

Sunday, May 10, 2015

Field Activity 11: Navigation with a GPS


Introduction

This lab was a continuation of field activities 3 and 10 which involved navigation of the UW-Eau Claire Priory. We were in our same groups as in the previous labs however this time we would be navigating the Priory with a different purpose. In this lab we would to create a new set of navigation points for future groups to use for this assignment. We were to collect these points using a GPS device and UTM coordinates. 

Methods

Since each group once again had three members the roles were divided accordingly. One person was to use the GPS, another should relate the map used in last week's lab to the GPS and the final group member should be in charge of determining the compass bearing as well as determining the most efficient route of navigation. 

The first step of this process was to work with the other groups to determine which regions of the Priory we would be working in so that there was little overlap of new navigation points. Next we needed to determine a total of 5 points which we would be navigating to making sure not to be close to the other groups. In order to keep the naming conventions consistent throughout the class we numbered each point first with our group number followed by the point number. 

Next we needed to test the navigation of our points. We marked each point by wrapping flagging around a large tree several times as well as using a marker in order to write down the location based on the naming scheme discussed in the previous paragraph. Next, we collected the point location using our GPS and took a picture of the points with a camera (Fig. 1-5). 


(Fig. 1A) This image shows point 5-1 from a distance.
(Fig. 1B) In order to properly label each navigation points we labeled the trees with flagging and marking the tape with the point information (Jacob is doing that for this point).
(Fig. 2A) This is a close up image of point 5-2.
(Fig. 2B) This image shows a view of point 5-2 from a distance.
(Fig. 3A) It is a bit difficult to see in this image but Jacob is marking point 5-3 on the right side of the image.
(Fig. 3B) A close up view of the location of point 5-3.
(Fig. 4A) This image shows point 5-4 from a distance after it was marked with flagging and the point number.
(Fig. 4B) This image shows a close up view of the location of point 5-4.
(Fig. 5A) Here point 5-5 can be seen and it is clear how important it is to properly mark the trees with flagging in order to ensure that whoever is navigating this course later can find the points.
(Fig. 5B) This image shows a close up view of point 5-5.
After returning from the field we used our GPS data to create a new navigation map of the Priory study area (Fig. 6). 

Discussion

This lab exercise combined the skills we learned in many of the previous labs. From using a GPS unit correctly to collect field data to navigation methods to mapping of GPS data we collected ourselves using ArcMap. The most difficult portion of this lab exercise was creating a navigation which did not come in contact with other groups. It was much easier this week to navigate the area though after our practice with our maps the week prior. Based on past experience we made sure to double check that our GPS was correctly recording the data points as we went to ensure that we didn't return to the lab only to find that something went wrong during data collection. 

Conclusion

Throughout this field activity we practiced applying all of the skills we have learned in this course thus far. It was also enjoyable to have the opportunity to work as a class. This lab helped us to practice the basic navigation skills as well as the the more modern techniques as well which was very valuable. 

Sunday, May 3, 2015

Field Activity 10: Navigation with Map and Compass

Introduction

In this weeks lab assignment we used the navigation maps created in Field Activity 3 to navigate through a course of 5 points at the UW-Eau Claire Priory created by our professor using only a compass and a copy of the maps we created. To successfully complete this lab we needed to orient ourselves so we could navigate from one point to the next. In groups of three students we were each assigned a different route to take as to challenge us to really test our navigation skills. We were in groups of three as it is necessary to have at least this many people to properly complete a distance-bearing navigation. The roles of each person are as follows: one will be needed to hold and use the compass, another to count paces and the final person to be the runner. 

Methods

Each group was first given the same starting point and a specific order in which we were to navigate the course. We were also given a list of point coordinates in decimal degrees which we plotted on the map which we created in Field Activity 3 (Fig. 1). When first creating the maps we were advised to create one which utilized decimal degrees and another which used lat/long to measure the UTM grids which were overlaid on all our maps.


(Fig. 1) This was the map we used primarily for our navigation. The other map we were given used lat/long which was of no use to us because we were given the navigation point locations in decimal degrees.
Once we had plotted the course points on our maps we were given instructions on how to properly use a compass from a fellow UWEC geography student, Zach Hilgendorf who is very knowledgeable when it comes to orienteering. He gave us instructions on how to properly conduct distance-bearing navigation to get from one point to another using only our maps and a compass. The first thing we were instructed to do was to assign roles for each of our 3 group members to one of the following jobs: bearing locator, runner and pace counter. 

The bearing locator's job is to use the compass to determine the direction that the runner should head in (Fig. 2). To find the bearing using the compass the edge must be lined up with the point where we were already located and the next desired location point. It's important to make sure that the travel arrow is pointed towards the direction you desired to go in. Also, the north arrow on the compass must be pointing towards true north according to our maps. After all of this is done the bearing can be determined using the bearing line, which when located means the compass can then be lifted off of the map. Next it is the person who was given the job of bearing locator to align the red north arrow up with the other red north arrow on the bezel which rotates. This is also known as putting "red in the shed". In order to start using the compass properly the direction of the travel arrow needs to be pointed towards the bearing of the location of your next destination. Now, it is the runner's job to move in the bearing direction as guided by the bearing locator to a landmark which can easily be navigated to. Next the pace counter will count the number of paces they are taking to determine the distance towards the point. Based on their pace they are able to determine approximately how far the destination point is to the beginning location. 


(Fig. 2) This is a compass similar to the one we used in this lab. The features which were mentioned throughout this lab are labeled here: 
1: base plate with ruler for measuring map scale, 2: rotating bezel, 3: rotating needle, 5: orienting arrow that is fixed on the rotating bezel and used to point north, 6: bearing line fixed on the base plate, 8: direction of travel arrow. 

Once our group had all of the points plotted and distances measured we made our way to the starting point, found our first bearing and headed into the Priory. It was difficult to navigate through the area because there were very tall thorn-covered plants and large trees which made it impossible to move in a straight line. It was very useful to have a third person in that situation though so we could maneuver around trees or thick areas of vegetation and still make sure we were going in the correct bearing direction. We found the first point quickly and then the second point took a bit longer because we had to navigate around a very steep slope which led to a valley rather than trying to go down and up it. It then became clear just how important it was in this lab to think critically and problem solve. It was much more difficult to make our way to the third point because that point was actually fairly close to the first point so we initially thought we were going in the wrong direction but once we checked our work we found we were correct and made our way to the third point. The fourth point proved to be difficult because we were forced down the steep slope and into the valley and then needed to make our way back up to get to the next point. The final point we navigated too we went past because we did not see it. Since we did not have pace measurements on either of our maps we struggled knowing how far we had traveled and how much further we needed to travel. 
Discussion

There were definitely some advantages and disadvantages to using the distance bearing technique in this lab activity. The first problem was our maps. We knew prior to making them in field activity 3 that we would only be given a compass alongside them to navigate a course of points however after completing the lab I could think of many changes I would have liked to make on the map which would have made the process much easier. For instance, we did not include our pace count on either of the maps which would have been extremely useful in calculating the distance from point to point. One benefit to our map was that it showed the entire area of the Priory rather than just the area of interest we were given. Since the entire navigation course was outside of the area of interest we were lucky that one of our maps had this area shown on a map. Also, other groups had problems because they had overlaid their legend on top of the map data and since we didn't know ahead of time where our navigation course would be within the Priory their legend ended up covering the entire course. This was not something I had thought of when creating my navigation map but it was something that was a very valuable learning point in this lab. 

Not only did we face difficulties with the maps but it was also tricky to make our way from point to point because of the very steep hills covered in loose soil and the thick foliage which was made up of primarily thorn-covered plants. We all seemed to agree that we should have dressed better, planning for the worst rather than expecting our paths to be "easy". 

Despite these problems we were able to navigate the course quite well. Our bearings were somewhat off but close enough that we were not more than 20 feet from each point so we were able to find them easily. 

Conclusion

This activity was very useful in learning how to properly conduct the distance bearing navigation technique. We had beautiful weather conditions and great instruction thanks to our instructors. It was very beneficial to learn how to navigate properly with only a map and a compass as most of us had not done so before. Despite the thorns which left us pretty cut up, we all managed to navigate the course with only a few problems. 

Sunday, April 26, 2015

Field Activity 9: Topographical Survey

Introduction

In this lab exercise we focused on topographical surveying techniques which involved the use of a Dual Frequency GPS and a Total Station. While both of these devices are survey grade units we gathered points using both in order to determine which was more accurate as well as become comfortable with how to use each device. 

Dual Frequency GPS

The device we used for our dual frequency survey GPS in this lab exercise was the TopCon HiPer SR unit (Fig. 1). This GPS unit has a remarkably high accuracy of less than 15mm. The HiPer SR unit can be mounted to a tripod and used with the TopCon Tesla controller unit (Fig. 2) to collect data points utilizing bluetooth to send the GPS data collected by the HiPer SR unit to the Tesla controller. 

(Fig. 1) TopCon HiPer SR Unit utilized in this lab.
(Fig. 2) TopCon Tesla handheld unit used to collect data throughout the lab.
In order to record data the HiPer must be angeled perfectly vertical thus it is important to use a tripod to make sure this is the case. Throughout this particular exercise we used the dual frequency GPS to collect elevation data so it was imperative to make sure that the tripod was balanced so that the process of actually collecting the data would only take a matter of seconds. This unit is very efficient because it is very lightweight depending on the tripod used and can be operated by just one person in the field (Fig. 3).


(Fig. 3) A surveyor using the TopCon HiPer unit mounted to a tripod in the field.

Total Station

Like the HiPer SR unit, the total station can be used in conjunction with the Tesla controller to record the data collected by the total station. The total station however utilizes a very different method in order to collect data. To collect data using the HiPer unit the surveyor moves thte entire unit however, when using the total station the unit does not move but stays in the same position. In most cases the total station is set above a US geologic survey marker and a series of points are set up prior to data collection knwon as back-site points.  These points are then used to mark the location of the total station unit. It is imperative to know the location of the unit prior to any data points being taken to ensure accuracy of the data collected. Once this is done the unit will send out a laster which is sent to another item, a prism attached to a rod. It is the prism and rod which are moved to collect data points rather than the GPS unit as in the case of the HiPer unit. The prism recieve the laser signal and then reflects back the data that corresponds to it. Like the tripod and HiPer unit, the prism and rod are light weight and very portable however the total station requires two people to operate it. One is needed to shoot the laser and the other to hold and move the prism and rod (Fig. 5). 


(Fig. 4) TopCon total station unit used in this lab. 

(Fig. 5) A TopCon total station being used in the field to collect survey data.

Methods

Our study area for this lab was the mall, or green space, on the UW- Eau Claire Campus in Eau Claire, Wisconsin. This was area of to focus on because of its size and easy access for students. After a great deal of data was collected using both the dual frequency GPS unit as well as the total station the data was used to determine elevation. The results of this lab can be seen in Figures 6 and 7. 

(Fig. 6) The map above shows the elevation data collected using the dual frequency GPS unit, the TopCon HiPer.

(Fig. 7) The map above shows the elevation data gathered using the total station unit, the TopCon total station.
Discussion

Since both of the instruments we used were of survey grade quality, the results from both units should have been very accurate and therefore it is likely that the errors seen in figures 6 and 7 were caused when we were collecting data. These results were not expected because when we collected the data we made sure to collect data points throughout the entirety of campus mall. However, in the mapped data above the points are not distributed correctly within the study area. Some of the points even intersect with the buildings. Looking at the very basic patterning of the elevation data is fairly correct in the general slope of the area in that closer to the main circle you get the lower the slope.

Setting up the units proved to be quite the challenge for both units because it was new technology my partner and I were not familiar with. There could have been issues setting up the back site points using the total station because that was something we struggled with prior to collecting any of the data points. If the back site data was incorrect then the location of the total station would be incorrectly recorded and then all other data would be collected in error as well. Since the set up process for the total station required so many more steps than the dual frequency GPS there was much more room for error. 

I am not quite sure where we went wrong when conducting these surveys but the data certainly did not turn out correctly as it didn't even expand to the full region of our study area. Also, a lot of the elevation data itself is not correct either and since the units themselves are so accurate it is most likely that the errors are caused by 

Conclusion

This lab proved to be extremely useful in that it helped us to become more familiar with various surveying equipment and now have a better idea of which unit is proper to use for certain situations. For surveying purposes its important to have a wide range of knowledge of various techniques to ensure that errors like those that occurred in this lab do not occur when the data being collected is for practical application. 

Friday, April 3, 2015

Field Activity 8: Distance Azimuth Survey

Introduction

In this week's lab exercise focused on conducting field research in ways that do not rely heavily on technology. Since a number of things could go wrong when in the field we learned a method of data collection that could be used if something were to happen to our technology. Whether it is the weather conditions that could render your technology nonfunctional it is always unpredictable if the technology that you are using to conduct your research will work properly. Should it fail it's important to know what you can do to still collect the necessary data because often you do not have unlimited access to your study site. Professor Hupy discussed many instances when this has happened to him and how he addressed the problem using distance/ azimuth surveying methods. By using this technique which does not rely heavily on technology you can still collect valuable information in the field no matter the condition of your technology resources. Throughout this lab we also gained a better understanding of how to properly employ this method. 

We used the TruPulse 200 units (Fig. 1) as well as Trimble Juno GPS unit to collect our data while in the field. The TruPulse 200 laser allowed us to select an object a large distance away, fire the laser from the unit to the object and gain information on the distance the object is from the TruPulse laser as well as the azimuth. The unit has more features as well but for the purpose of this particular lab we only focused on the horizontal distance and azimuth information.


(Fig. 1) The TruPulse laser shown above was the unit we used in the field to collect distance and azimuth data. The user points the unit at an object and after finding the object that they wish to collect data on through the magnified zoom they can fire the laser at it and gain the corresponding data. This particular until allows for the collection of horizontal distance from the unit to the object, the azimuth, and can also be used to determine vertical distance or height of an object and more.
Methods

For this lab exercise we were assigned partners and then needed to select a study area where we could collect a minimum of 100 data points within the city of Eau Claire. This data must include the distance and azimuth data as well as attribute information in order to better identify the points once we begin to analyze our results. We completed these goals by first selecting a study area, followed by collecting out 100 points and then using ArcMap to plot the data on a satellite image basemap of our study area. After conducting some research by reading past blogs from former students in the class Joe and I decided that Randall Park would be the perfect study area because it was the right shape and size for this particular exercise. 

Data Collection

Once Joe and I decided on our study area of Randall Park we met there on the morning of Wednesday April 1st. It was a beautiful, sunny, 65 degrees however very windy. In order to collect the distance and azimuth data for points throughout the park including trees, benches and lamp posts, we needed to determine the places where we would position the TruPulse laser and gather our points. It was important to chose a corner of the park since once we decided on a place to take distance and azimuth data from we could not change it.  We mounted the laser to a tripod to maintain consistancy as we collected our data. From the unit we then would aim the laser at an object such as a tree or bench within the park and then record the distance and azimuth information. This would then be repeated. Joe and I switched off using the laser to collect the data and using a laptop to record the data into an Excel spreadsheet. 

After collecting a number of points from one corner of the park we moved to the other 3 to increase the number of objects we collected data on. By collecting information on objects from all 4 corners of the park we could create a better and more complete map of the objects in Randall Park. Each time we moved the TruPulse laser and tripod to a new corner we recorded the X and Y coordinates where the unit was placed. This will help us when digitizing our data later in ArcMap. 

ArcMap and Interpretation of Data

The first step in interpreting the data was to import the excel spreadsheet data into the file geodatabase I created for the project. It was important to classify the X, Y and other numeric fields as such rather than being just "general" so that they are properly interpreted in ArcMap. The next step was to use the "bearing distance to line" tool to translate the distance and azimuth data into points based on how they relate to the X and Y data (Fig. 2). The method by which this is done in ArcMap can be seen in Fig. 3. 


(Fig. 2) This image shows the output of our excel spreadsheet data after it was run through the bearing distance to line tool in ArcMap. 
(Fig. 3) Illustration of the bearing distance to line tool in ArcMap.
Once the bearing distance to line tool was applied to the data it was time to convert the data into points using the "feature vertices to points" tool in ArcMap. After this was applied I was able to view the data points we took information on in the field (Fig. 4). I was then able to load in a basemap of the study area and determine how accurate the data collection was and produce a map. d


(Fig. 4) After the feature vertices to points tool was applied to the bearing distance to line output image shown in Fig. 2, it was possible to view the data points we took data on while in the field as point features. 
(Fig. 5) This finished map shows our study area of Randall Park along with the bearing line and feature points we recorded when in the field.
(Fig. 6) This image shows a cleaner view of our final results since it just displays the feature data points collected with a key to show what each data point represents.
Discussion

This lab proved to be very useful because it gave us the knowledge base to conduct field data collection even if our technology were to fail. We were very fortunate to have nice weather conditions when we went to Randall Park to collect our data. This park proved to be a perfect area for this study because it was not too large or too small and also had set corners because of it being a park surrounded by sidewalks. 

While to process of collecting the data went pretty smooth there we did run into some problems. Since Joe and I switched off who was in charge of collecting the points using the TruPulse unit and recording the data on the computer, it was hard to remember which points we already collected. It was also difficult to gain accurate readings using the Trimble GPS unit to get our X and Y data. 

We did find it extremely helpful to use the laptop in the field because it saved us an extra step in the post processing of our data since we didn't need to take our written data and then type it into a spreadsheet. 

Applying the various tools in ArcMap did present some other problems as well. We first realized that we had mixed up our X and Y data and needed to switch them accordingly as well as add a negative sign to the X values based on where Eau Claire is located. This helped to make the bearing distance to line tool create an output image like we expected (Fig. 2). Next, I noticed that when I applied the bearing distance to line tool to the original table I imported into my geodatabase, it did not carry over the attribute data so I needed to join the two attribute tables together to make sure this information was available. This proved to be extremely important when organizing the point data to classify it so that it was more presentable in a map format. 

Once I was able to view the final product of our map with the basemap loaded into the data frame it was easy to notice that our X and Y coordinates taken by the Trimble GPS unit were not accurate. When we were in the field we made sure to stand at each of the four corners of the park on the sidewalk so we could best determine how accurate our GPS data was. As can be seen in Fig. 5, our X and Y coordinates for the origin of where we took all of our data was not very accurate at all.

Conclusion

I found it extremely beneficial to learn this new method of data collection which did not rely so much on a functioning GPS unit but rather could be used to troubleshoot should there be technical issues when in the field. This methodology can be extremely useful and does not require the use of a laser particularly but instead a survey tape measure can be used to calculate the distance and a compass can be used for the azimuth information. It was interesting however to have the opportunity to work with the TruPulse laser unit to collect our data and import it into ArcMap to determine the accuracy of the data collected in the field. 

Saturday, March 14, 2015

Field Activity 7: ArcPad Data Collection Part 2

Introduction

In this week's lab exercise we performed the same activity as we did last week however in this exercise we actually collected our microclimate data. As pairs went to various zones of UW Eau Claire campus to take a total of 50-100 microclimate data points. Using the Kestrel units provided for us we were able to collect temperature at the surface and 2m, dew point, relative humidity, windchill, and wind speed. The more points where we collected this data the more accurate of an overall microclimate dataset we would have for the study area. For this reason it will be the best use of our time and resources to divide up the UW Eau Claire campus. 

Method

First each of the 7 groups of two were assigned on of the predetermined zones which would be our areas of focus within the study area. Once they were assigned we repeated the process of deploying the basemap and geodatabase to our Trimble Juno GPS units to take into the field with us to collect our data. One thing that is different about this week's procedure compared to last was the geodatabases we used. Since we wanted to collect microclimate data from different areas of the campus and compare it all we needed to have the same geodatabase to use in order to keep our data collection consistent. After deploying the data to the GPS units we headed outside to start our collection process.
This image shows the 7 zones that the UW Eau Claire was divided into for data collection outlined in red. The yellow points were each spot where microclimate data was collected by the members of the Field Methods class.

On the day we went out into the field it was a beautiful, windy, partly cloudy, around 55 degree day. We took data points about every 15 to 25 feet to cover as much area as we could while not collecting overlapping points. Once we all finished collecting our 50 points within our zone we grouped the data together in order to compile a map showing the microclimate data of the entire study area. After everyone uploaded their feature classes into the class geodatabase it was imperative to combine the feature classes into one since until this is done the data is useless since every group classified theirs differently.  Then after everything was combined we were able to construct various maps to show the microclimate data we collected and how it differed throughout the campus. 

This map shows the distribution of relative humidity within the UW Eau Claire campus study area.

Discussion

The hands on experience of going out into the field to collect the microclimate data proved to be a very interesting learning experience. It was a useful exercise to practice gathering data using the Trimble GPS units, ArcPad and the kestrel units. At first I thought that using the equiptment would be easy however I needed to review how to gather points and other functions of the units. By the end of the activity though I felt very confident using the units. 

While organizing the class data it became more clear just how important it is to coordinate with everyone prior to going into the field. Not only was it so useful to use the same geodatabase for collecting the data but also determining the best way to break up the study area so that we could cover the greatest amount of area in the time constraint of class. This pre-planning was crucial to the success of this project. Also, having a week of practice prior to data collection in the field was really nice since it gave everyone a chance to become more familiar with the equipment and procedure. 

Conclusion

Even though this was only a class field activity to collect microclimate data to be used in a UW Eau Claire campus map, it was a great deal of work. Not only was it a complicated process to prepare the geodatabase that could be used in the field effectively, utilize ArcPad to collect the data, making sure to properly use and read the other instruments in the field and downloading the data to prepare it in ArcMap. 

It was really nice to have the whole class work together on this project, especially when technical problems arose we could all work together to solve it. Team work is important in any line of work but collaborating with peers in this case was great practice. Working together to develop a project and divide up the workload to collect data is something I can see being a real world example so I really appreciated the experience. 

Friday, March 6, 2015

Field Activity 6: ArcPad Data Collection Part 1

Introduction

This week's activity was the trial run of utilizing our geodatabases created in Field Activity 5 to collect microclimate data on the UW-Eau Claire campus. We were divided into 7 groups of 2 and tasked with practicing data collection using the Trimble Juno GPS units and the program ArcPad. To collect the weather data itself including wind speed, temperature, dew point etc we used handheld Kestrel weather detectors. The first step in this process was to get the project ready in ArcMap and deploy the map and geodatabase information onto the GPS unit to collect data in the field. The reason for this test run was to determine if there were any problems with the geodatabases we created that would need to be resolved before collecting our data. This proved to be very useful since it showed where the flaws existed in my geodatabase that needed to be fixed before it was to be used in the field. 

Methods

The first step in this process was to get the project reading in ArcMap. To do this I imported the feature class that is apart of the geodatabase I previously created. I found that it was very important to import this feature class before bringing in any base map data into the project in ArcMap to ensure that all the other data was in the same coordinate system. The base map data serves as a background which can be used on the Trimble GPS units to show where in the study area my data points were collected. It acts as a reference for the data points collected in the field. I found the best base map data could be downloaded online within ArcMap of a street view map of the UW-Eau Claire Campus area. I also imported another image from the department data of Eau Claire County. 

The next process was to deploy the data onto the Trimble GPS unit from ArcMap which was done using the ArcPad Data Manager Toolbar. After making a copy of the deployment and moving it onto the storage card of the GPS unit I was able to view the base map as well as take data points with the various attributes that I created last week in the domain of my geodatabase. We then went outside to test out this system and take some test points. After our test points were taken we exported them off of the GPS units and into ArcMap to view and analyze our data.

Discussion

I learned quite quickly that there were some problems with my geodatabase once we got into the field to test them. First, I realized that I had forgotten to include the domain for relative humidity which is important in our analysis of the microclimate of the UW-Eau Claire campus. 

I also encountered further problems when I attempted to download the data I collected in the field onto the computer. For unknown reasons when I used the ArcPad Data Manager tool to import the data from my GPS unit into ArcMap my data points would appear in the dialog showing that they were indeed collected however when I went to import them the data would not show up on my base map. After a lot of troubleshooting with my professor and fellow classmates we solved the problem by simply right clicking on the feature class and selecting the option to "zoom to layer" and my data points appeared as they should. 

Conclusion

Overall I found it extremely helpful to have a week where we simply had a chance to get to learn the equipment we would be using for our data collection prior to actually collecting the data. I have a better understanding now of how important it is to test out not only your field methods but also equipment in order to make sure that you have set everything up correctly and that they will serve their proper purpose. Had we not tested out our geodatabases before collecting the data I would not have had all the domain fields necessary to collect all the microclimate data we needed. It was also better to troubleshoot when the data was only practice and I had not spent hours in the field collecting it since now I will have a better understanding of how to address this problem, should it come up again. 

We also decided as a class to create one geodatabase that would be standard and used by all the groups in the next week when we did our actual data collection in the field. This way we could divide up the campus based on our 7 groups and share our data to create a microclimate map of the entire Eau Claire campus rather than just a small portion of it. 

Saturday, February 28, 2015

Field Activity 5: Geodatabases, Attributes and Domains

Introduction

Our task in this field activity was to create a geodatabase in ArcCatalog which we would use in the coming weeks to collect data and ultimately create a microclimate map. Developing and creating a geodatabase may sound like a simple task however it is of great importance to make it correctly. Using ArcCatalog makes the process of creating a geodatabase easy but setting it up properly for data collection is a whole other task in and of itself. In this exercise we worked on pre-planning for a future field activity where we would be using our geodatabase in the field for data collection. This report is divided into two parts: part one focuses on the importance of having the properly set up geodatabase and part two will act as a tutorial on how to the microclimate geodatabase was actually created. 

Methods

Part 1:

It is crucial when conducting field work to be well prepared. In order to properly utilize tools like ArcPad we can install a geodatabase to collect data. Geodatabases can be used to manage and store data when using ArcGIS. Data can then be easily accessed and is a way to organize GIS data. When working toward planning for field work by creating a geodatabase the biggest aspect to consider is the domain. A domain is a range or group of valid attribute values that can be used in order to record features collected in the field. These geodatabases are important because they can ensure that the entry of the data is accurate and also consistent. Single domains can be used for many feature classes within a single geodatabase since the domain is merely a property of the greater geodatabase which can be set. 

There are a number of different domain field types which can be set including: short and long integer, float, double, text and date. These can be used to better classify the data values in order to maintain consistency of the data while in the field. An example of this can be found in our future project. Say that someone wishes to collect land cover type at various points in their study area. The would set their domain as text with predefined values such as snow, grass, gravel, concrete and other. By setting the possible values of the domain it will not only speed up the process of data entry in the field but also serve as a way to standardize data and minimize possible error. It is also important to set ranges for data like temperature to prevent any accidental errors like inputting 200 degrees fahrenheit when you meant to put 20. Setting a reasonable range of 0 to 100 degrees it will help to avoid numerical errors as well. By completing all of this work prior to field work it will save time and frustration of needing to correct for errors later.


Part 2

The process of creating the microclimate map which we will be developing in the coming weeks involves various stages which can be seen below. 

Geodatabase Pre-Planning

It's important when creating a geodatabase to take into consideration before you start making it what the purpose of it is. For instance, in this lab we are working to create a geodatabase to organize microclimate data. Microclimate is basically the climate of a small area that is different than other parts of the surrounding environment. An example of this could be that an area blocked by wind such as the courtyard in Phillips hall or behind another building on campus might be warmer than open areas like the campus mall not that much further away. Microclimates don't have to be limited to a small size though, they can also be large like the comparison of climate in a downtown, urban area compared to a surrounding rural land. 

It's important to determine what information we will need to collect for this map which will ultimately act as a way to visualize microclimates to the viewer. Some data that would be valuable to this study includes: temperature (both at the surface and at eye level), dew point, wind chill, ground cover, wind speed, direction of wind etc. All of these need to be included in plans for our geodatabase for this map.

Creating the Geodatabase

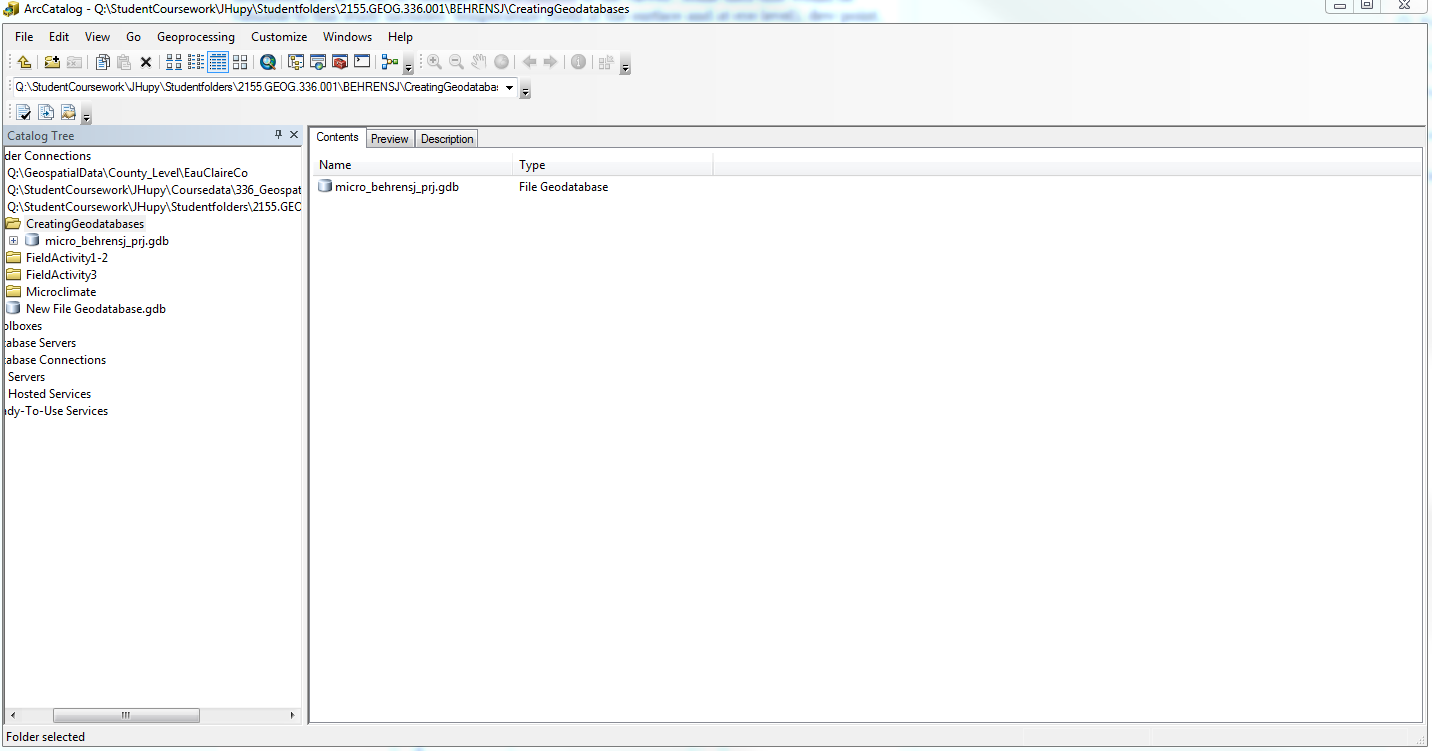
The next step is to actually create the geodatabase itself. The best way to do this is to start by opening ArcCatalog. Then choose a folder in which you want your geodatabase to be created in and right click on the screen and select the option "new" and "file geodatabase" (Fig. 1).

(Fig. 1) This file geodatabase was created and named "micro_behrensj.gdb" since it will be where all the collected microclimate data from the field will be stored until it is analyzed and incorporated into the final microclimate map.
Setting Up Geodatabase Domains

Creating the domains in a geodatabase is very important to do correctly but can often be the most tricky part of geodatabase set up. Domains can be defined as rules that are applied to a field within a table which work to enforce the integrity of data by making it so that only the predetermined values for specific domains can entered. In this case to set the domains you right click on the geodatabase that you created and select the "properties" option. Then by selecting the "domains" tab you can set the domains and their ranges (Fig. 2).
(Fig. 2) Within the domains tab there are tables where the domain name, description, and other properties can be entered. There can be multiple different domains with different properties within the same geodatabase. This makes it so that you don't need to create as many feature classes but rather can organize your data within the geodatabase itself while collecting the data in the field.
Setting the range values and the field type are the two most challenging decisions that need to be made when assigning domain properties. As can be seen in Fig. 3, all the variables of microclimate which we want to collect data on are listed under the domain name. For example, setting the range for temperature it seems logical to set the minimum value at -30 and the maximum value at 60. Since we will be collecting whole numbers the short integer field type was selected. All of these parameters can be set individually based each domain's different requirements. After all of these steps have been completed you have a well thought out geodatabase that can be used in the field for data collection.

(Fig. 3) The range and field type of the domains are set separately for each of the domains to ensure that they are the best properties fit for the given data that will be collected in each domain.
Conclusion

While I previously had always thought that creating a geodatabase was a simple and rather trivial task I learned through this activity that it can be very important and help to ensure more success in the field. Pre-planning a project using domains to organize data in geodatabases can minimize errors and speed up the process of actually collecting the data values while in the field. Domains are extremely useful in that they minimize the number of feature classes that are created because they can organize data in a way that does not require more than a single class. The creating of a geodatabase prior to field work is crucial and a rather simple way to stay organized.